
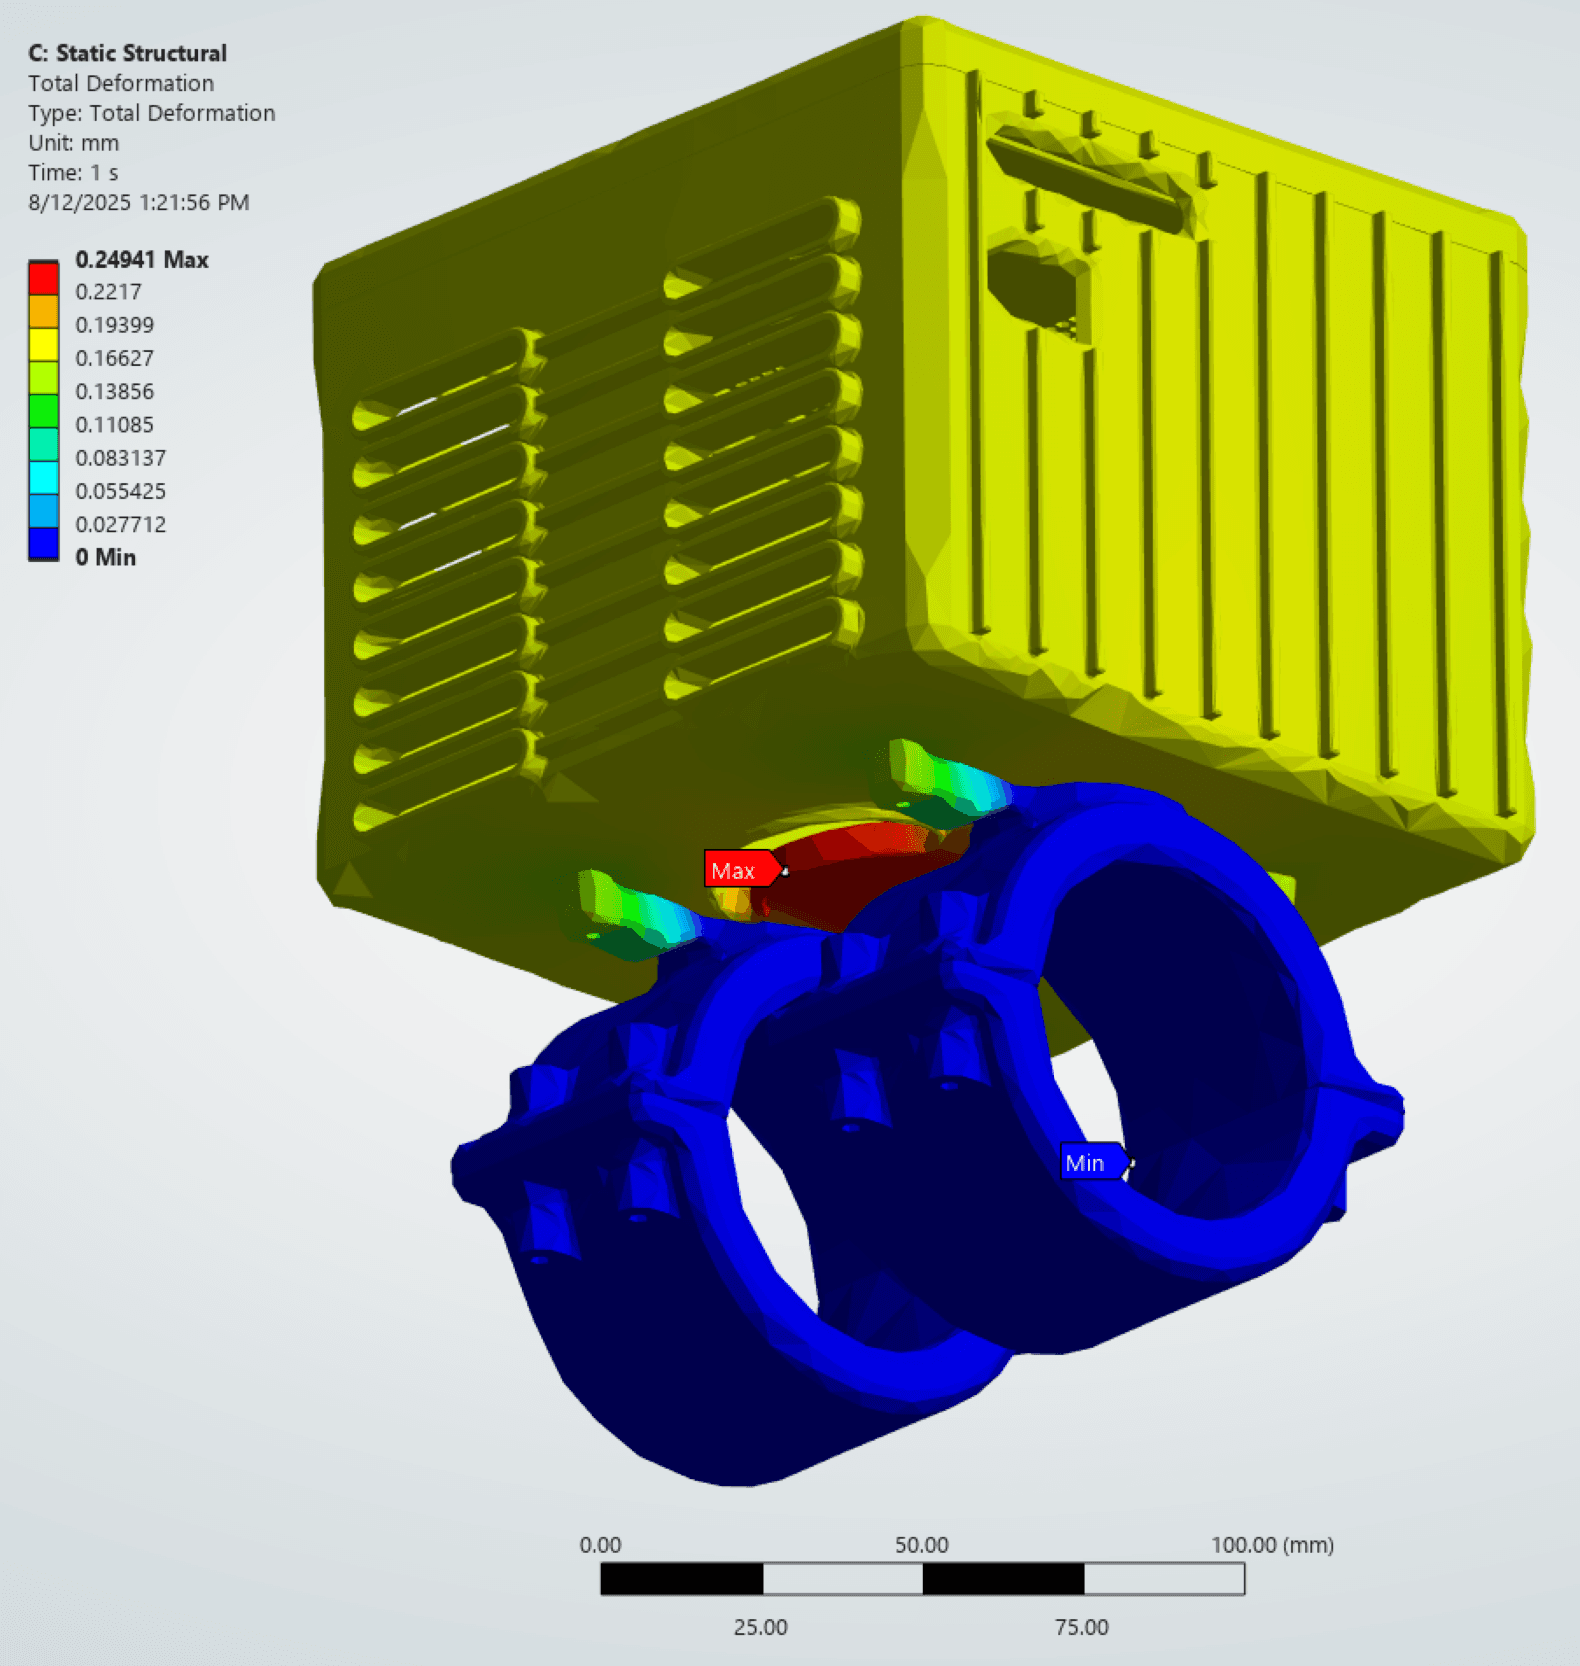
- modeled peak stress
- 40.7 MPa
- Simulation
- CF-PETG yield, screening value
- 70 MPa
- Assumption
- yield screening ratio at 100 G
- ≈ 1.72
- Simulation
V1.0
Baseline
- Wall
- 9 mm
- Max temp
- 58.9 °C
- Max stress
- 32.5 MPa
- Mode 2
- not recorded
V1.1
Side vents added
- Wall
- 9 mm
- Max temp
- 47.2 °C
- Max stress
- not recorded
- Mode 2
- not recorded
V1.2
Wall thickness reduced
- Wall
- 7 mm
- Max temp
- 43.2 °C
- Max stress
- 45.3 MPa
- Mode 2
- not recorded
V1.3
External ribs
- Wall
- 7 mm
- Max temp
- 44.6 °C
- Max stress
- 40.7 MPa
- Mode 2
- 271 Hz
V1.4
TPU damping (final)
- Wall
- 7 mm
- Max temp
- 44.6 °C
- Max stress
- 40.7 MPa
- Mode 2
- 215 Hz
Iteration data from the Alef design review.
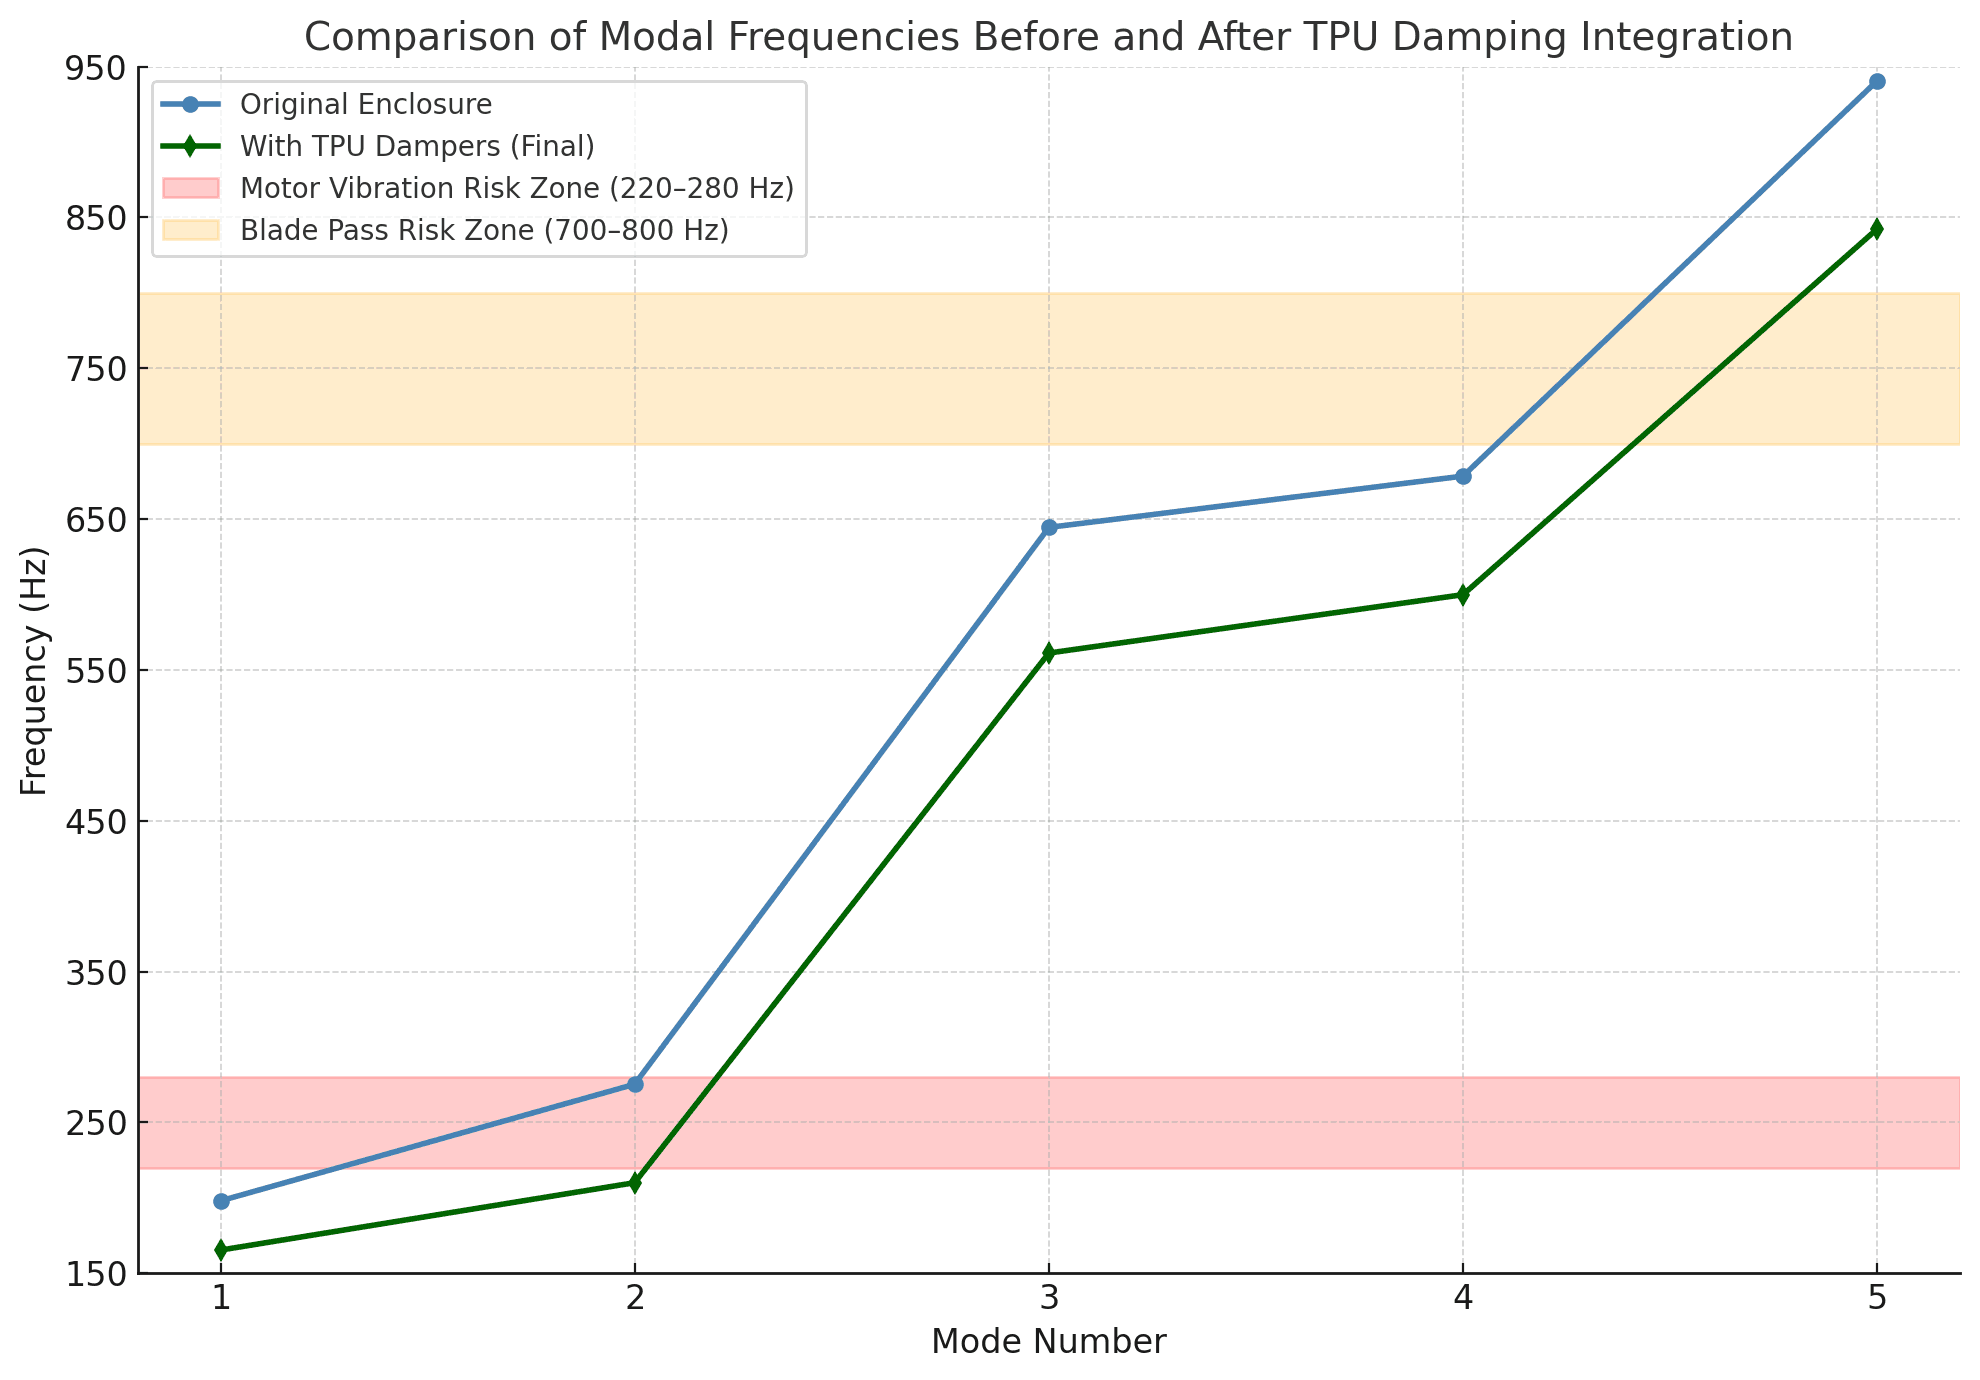
Mode 2 moved from 271 Hz, inside the 220 to 280 Hz motor band, to 215 Hz, below it. The blade-pass band is 700 to 800 Hz.
- CF-PETG, printed by FDM
- Wall 9 → 7 mm cut print time and cost
- Ribs instead of a thicker wall
- Vents with rounded slot ends
Next steps
- RTD and thermocouple instrumentationChecks battery and wall temperatures against the 44.6 °C simulationPlanned
- Drop testsChecks the 100 G crash-load assumptionPlanned
- Long-term vibration testingChecks how well the TPU damping holds upPlanned

Mechanical Engineering InternJul – Sep 2025
Alef battery enclosureOne enclosure. Three competing demands.
A 3D-printed CF-PETG enclosure that clamps a LiPo battery pack to the carbon-fibre tube of an electric aircraft. Designed, analyzed and iterated during my internship at Alef.
Define the problem
The battery had to survive impact, reject heat, and stay away from damaging vibration at the same time.
- crash load to survive
- 100 G
- Assumption
- battery temperature target
- < 60 °C
- Design
- motor excitation to avoid
- 220–280 Hz
- Assumption
Lithium-ion performance degrades above 60 °C. The ~250 Hz motor value is typical operating speed in cruise (40–50% throttle).
Build the load path
The enclosure starts with the load path: where impact enters, where it travels, and where the battery is isolated from it.
Two clamps carry the enclosure on the tube. External ribs stiffen the walls between them. The battery sits inside, separated from the shell at its contact points.
Structural analysis
The structural model treated the crash event as an inertial load case, not a point load applied to a convenient face.
A 100 G crash acceleration, applied as a body load to the 2 kg battery and enclosure, with the clamps held fixed. Static rather than transient: the question was overall stress and deformation.
- a = 100 g, m = 2 kg
- F = m·a
- Assumption
- maximum total deformation
- 0.25 mm
- Simulation
Acceleration from comparable light-aircraft crash data (NASA TM-2002-211733). Static was the more conservative, cheaper check. A screening model: it does not capture impact dynamics, FDM layer strength or fatigue.
The modeled peak stress was 40.7 MPa. Using the stated 70 MPa yield screening value gives a preliminary ratio of approximately 1.72.
Beam theory, with the clamps as fixed supports, checked the FEA deflection and peak stress by hand.
Manage heat
The battery target was below 60°C. The enclosure had to move heat without weakening the structure around the vents.
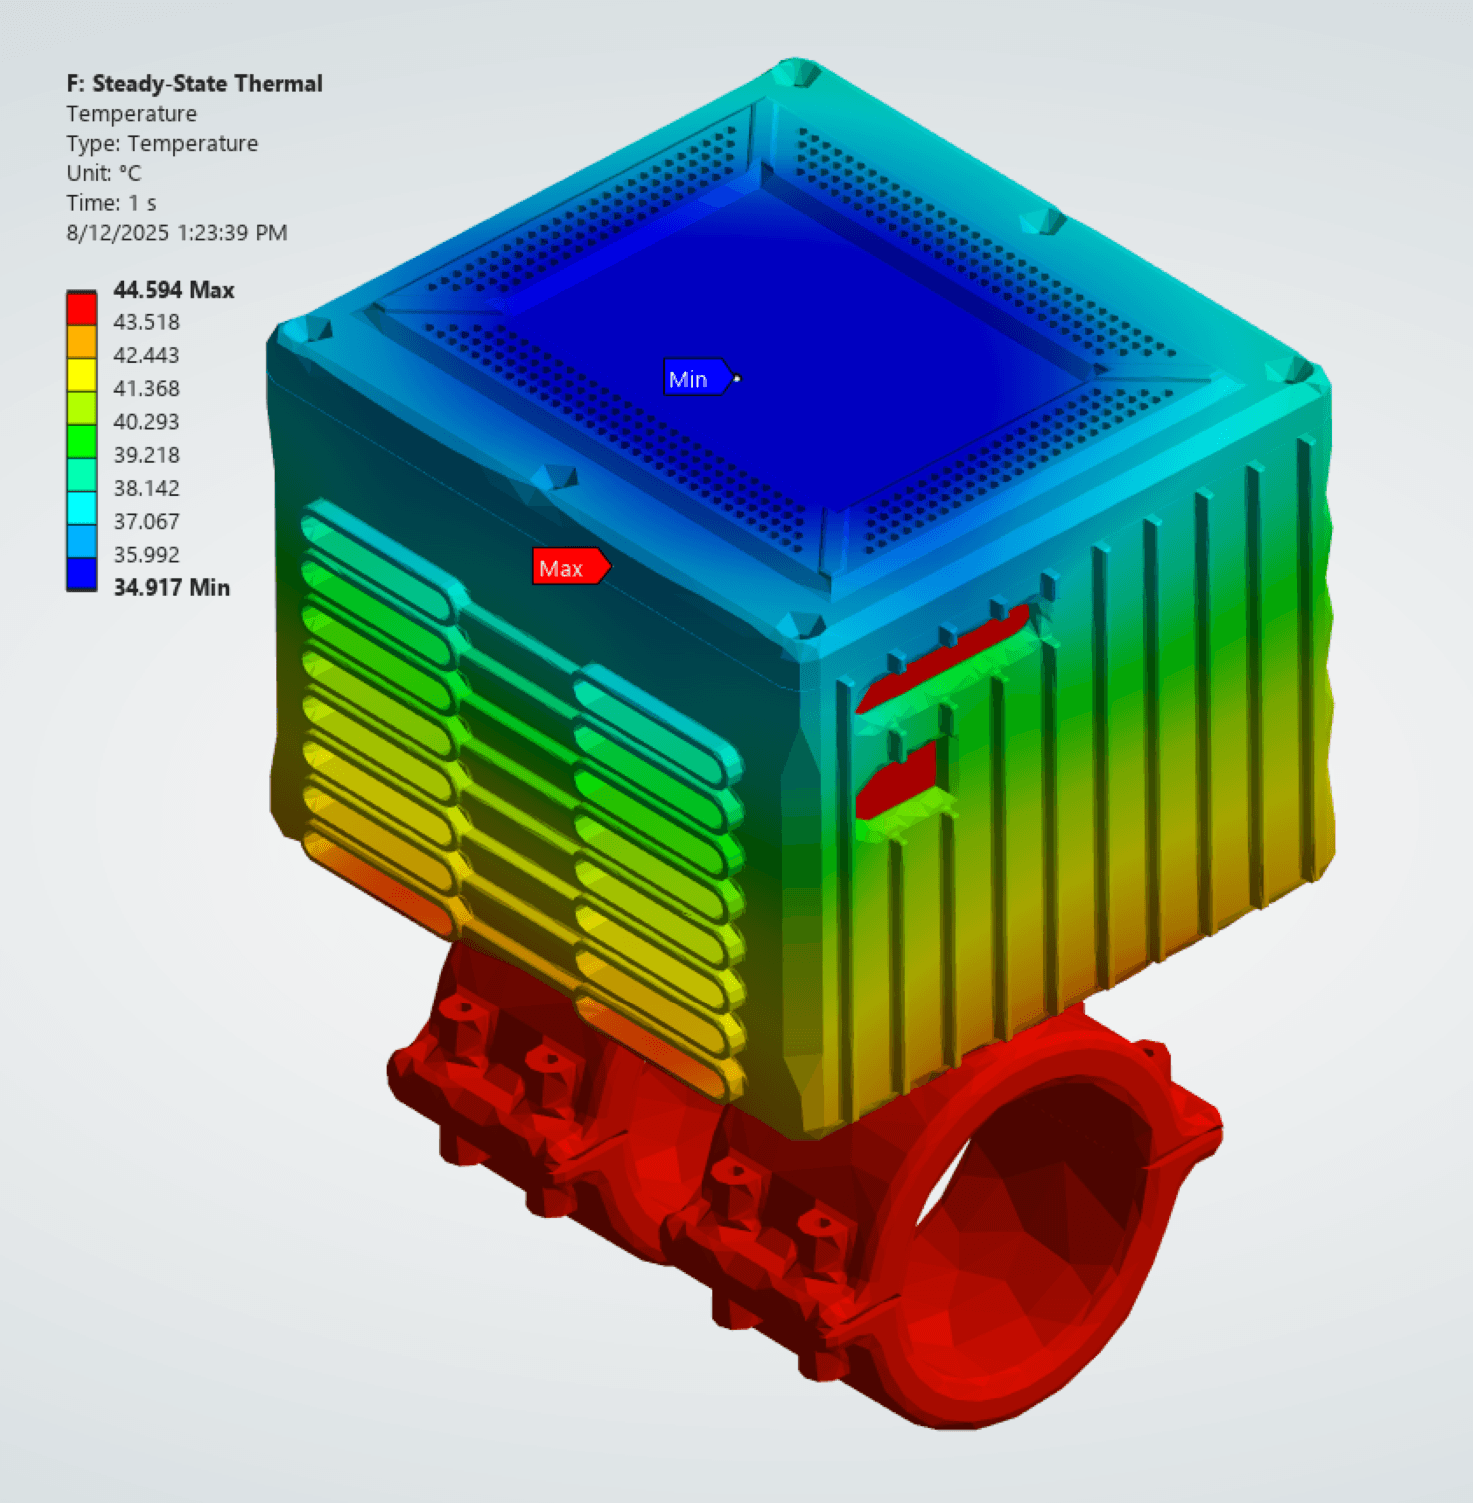
Steady state, for the worst sustained temperature rather than short spikes. Heat was taken as the 10% a 90%-efficient pack loses at a ~300 W draw.
- maximum simulated temperature, final design
- 44.6 °C
- Simulation
- CF-PETG glass transition
- ≈ 70 °C
- Assumption
Heat rate Q = 0.1·V·I, with V = 3.7 V per cell. Convection coefficients researched for stationary and moving flight and checked with a senior engineer. Flow arrows are illustrative, not CFD.
Iterate the enclosure
Venting lowered temperature. Thinner walls reduced print time. Ribs recovered stiffness. TPU changed the interface behavior.
Each revision helped one requirement and taxed another. The vents raised peak stress through local stress concentrations; the ribs won it back with little added mass.
The model shown is an earlier CAD revision with a 4 mm wall; the final design uses 7 mm. The feature each revision changed is highlighted. Dashes mark values not recorded for that revision.
Avoid resonance
The enclosure also had to avoid the aircraft vibration environment: approximately 220–280 Hz motor excitation and 700–800 Hz blade-pass excitation.
The second natural mode sat at 271 Hz, inside the motor band. Instead of stiffening the shell, localized TPU at the mounting interface and the battery contact points moved it to 215 Hz.
- mode 2, before and after TPU
- 271 → 215 Hz
- Simulation
A secondary effect of adding damping at the interfaces. Mode shape render: future update.
Design for printing
This was a 3D-printed prototype, so print direction and layer behavior were part of the structural design.
FDM parts are weaker between layers than along them, so the enclosure is not treated as isotropic. Ribs restored stiffness where the vents removed material, and the thinner wall cut print time and cost.
Validate and close
The next step is validating the enclosure physically: RTD and thermocouple instrumentation, drop tests and long-term vibration testing against the modeled assumptions.
- yield screening ratio at 100 G
- ≈ 1.72
- Simulation
- maximum simulated temperature
- 44.6 °C
- Simulation
- mode 2, clear of the 220–280 Hz motor band
- 215 Hz
- Simulation